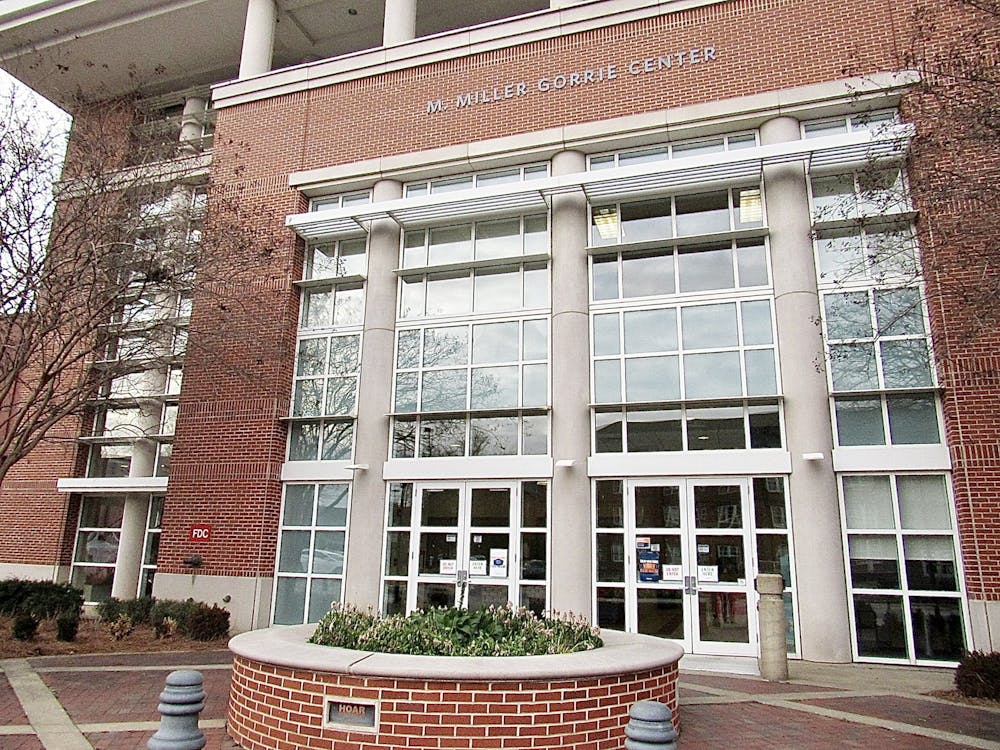
The McWhorter School of Building Science is creating a digital history of Bloody Sunday using Light Detection and Ranging Scanners and historical information to create models of the historical site.
“Bringing History to Life: ‘Bloody Sunday’ at Selma” will feature a 3D rendering of the events that unfolded in the civil rights standoff that occurred on March 7, 1965. John Lewis led over 600 marchers through Selma, Alabama and across the Edmund Pettus Bridge before they were attacked by state troopers, remembered widely as “Bloody Sunday.”
Richard Burt, head of the McWhorter School of Building Science, said the project dates back to 2016 and is intended to be a detailed recreation of the events of Bloody Sunday.
“What we are trying to do is put together a sort of map of what the site looked like in 1965 because … that provides a starting point to do a lot of stuff based around historic preservation and learning about the events that went on there,” Burt said.
After marking close to over 4,000 individual points and using software to render them together, the team now has a drawing of what the site looked like in 1965 including the surroundings and positions of the marchers. Now the goal is to identify the names of the people who marched on Bloody Sunday and put names to their faces, which is what the Tiger Giving Day funds will help contribute to, Burt said.
“I thought it was really bad to give a number to these people that were extremely brave, many of them high school kids,” Burt said. “We thought there is bound to be a list somewhere, but there is not.”
Burt said if the school can reach its $5,000 goal for Tiger Giving Day, those funds can be used to obtain historical photos from the Briscoe Archives at the University of Texas and the National Archives in Washington, D.C. that will aid in understanding the key players and as many marchers as possible that were involved in the conflict.
“We know that they marched in twos and pretty much stayed in the same formation from about two miles away,” Burt said. “The conflict occurs for about five to 10 minutes, so we want to be able to show where some of the important people, how they moved around the site.”
Burt said the site of Bloody Sunday is “probably one of the most significant historic sites in the U.S. that came about in the 20th century.”
“The level of support that is given to ... other battlefield sites compared to how much the national government has provided to [the site of Bloody Sunday] does not bear comparison... so we are trying to tell the story of the place where this conflict occurred,” Burt said.
Editor's note: This story was written before the conclusion of Tiger Giving Day at the end of Feb. 24. The project raised $8,320 of its $5,000 goal from 108 donors when the donation period closed, 166% of its requested funding.
Do you like this story? The Plainsman doesn't accept money from tuition or student fees, and we don't charge a subscription fee. But you can donate to support The Plainsman.


