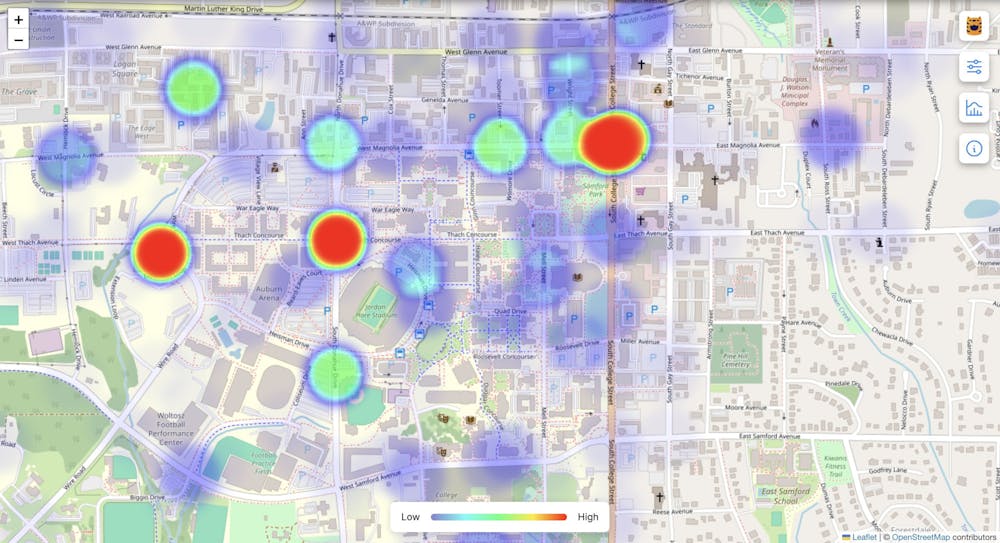
Auburn University senior in software engineering Matthew Rogers recently released a website forming a heatmap visualization of crime statistics around Auburn University. The website creates an image showing the usually unseen prevalence of crime on the Plains.
“I tried to make it [the heatmap] with bright colors, you know, but ultimately what it shows is really sad,” Rogers said. “If you filter for the sexual assault class of crime, for instance, you see that the vast majority of them are concentrated at a few apartment complexes, which is really heartbreaking to see.”
Indeed, filtering for sexual assault crimes shows a hotspot representing 24 distinct incidents on the block of Glenn Avenue near The Standard.
“I don’t want to say The Standard because they only have to report the block, and it’s not directly on it, but that’s the biggest thing really there,” Rogers explained.
Rogers’ website is part of a larger project he has termed "Open Auburn," which he hopes will make all of the university's publicly released data centralized and usable for anyone trying to use it for research.
“The problem is that Auburn makes a lot of their data public on their website, but it’s sort of stuck there. You can’t really download it, use it in any projects, or do any research with it,” Rogers said.
Much of this data exists because public universities have strict reporting requirements they are obligated to fulfill to maintain transparency. Crime data, for instance, is required because of the 1990 Cleary Act. However, Universities are not required to post their data in a format conducive to easy research.
Rogers embarked on the development effort in 2022. Trying to create a project like his new heatmap, Rogers found the data he needed difficult to use.
“It takes a lot of labor and a lot of time. I was going to do that process to it anyways, because I had some ideas I wanted to do with it. So, I was like, ‘Well since I’m already making this data usable, why don’t I just open it up and make what I process publicly available, right?’” Rodgers explained.
To assemble each dataset, Rogers grappled with numerous issues while collecting information. He has written individualized code for many of Auburn University's websites to 'scrape' or collect valuable data from them.
According to Rogers, Auburn publishes data about energy usage, sustainability data, academic and student life, professorial salaries and even some reports on Greek life. He explained that while he has already compiled and published some of these datasets, others will take longer.
When asked what his next project is, Rogers enumerated ideas to evaluate Tiger Transit’s consistency and timeliness.
“You have to go digging, but you can get this real-time bus data. So what I’m doing right now is hoarding all that data, and I hope to use it to provide students with more accurate predictions of when buses will arrive,” he explained. Adding, “A common critique of Tiger Transit is that they don’t really match what the app predicts and what the university puts out. They sort of develop their own schedule.”
To sum up the impact he hopes to see from his work, Rogers said, “I hope to see it used by more technical people in their projects and research and to see that trickle down into the community.”
Do you like this story? The Plainsman doesn't accept money from tuition or student fees, and we don't charge a subscription fee. But you can donate to support The Plainsman.